Cheetah-MS documentation
Overview
Cheetah-MS is an automated workflow to determine protein-protein interactions as part of targeted chemical cross-linking mass spectrometry (TX-MS) protocol; Cheetah-MS is a fast and robust web server which combines the capability of MS to analyze complex samples and the sensitivity of targeted MS with the power and resolution of protein structure modeling and protein-protein docking.
Cheetah-MS combines these technologies playing on their respective strengths and at the same time overcoming their weaknesses. As the core analyzer of TX-MS protocol, Cheetah-MS has been validated by recognizing the interactome of an important bacterial surface protein M1 and producing a 1.8 MDa structure supported by more than 200 XLs constraints.
Cheetah-MS workflow produces the complex structure for the protein-protein interaction of interest by analyzing data from Shotgun MS/MS acquisition technique (called also MS2 or DDA data) and combine them in molecular docking models. The power of Cheetah-MS relies on its fast convergence to the solution due to iterative sampling and filtering by XLs where we reduced the number of decoy sampling by the order of magnitudes.
Quick access to the workflow submission page:
When using this web server, please cite the following references:
Cheetah-MS: a web server to model protein-protein interactions using shotgun mass spectrometry data, in preparation
Rapid determination of quaternary protein structures in complex biological samples, Nature Communications, 10, 192 (2019)
Algorithm
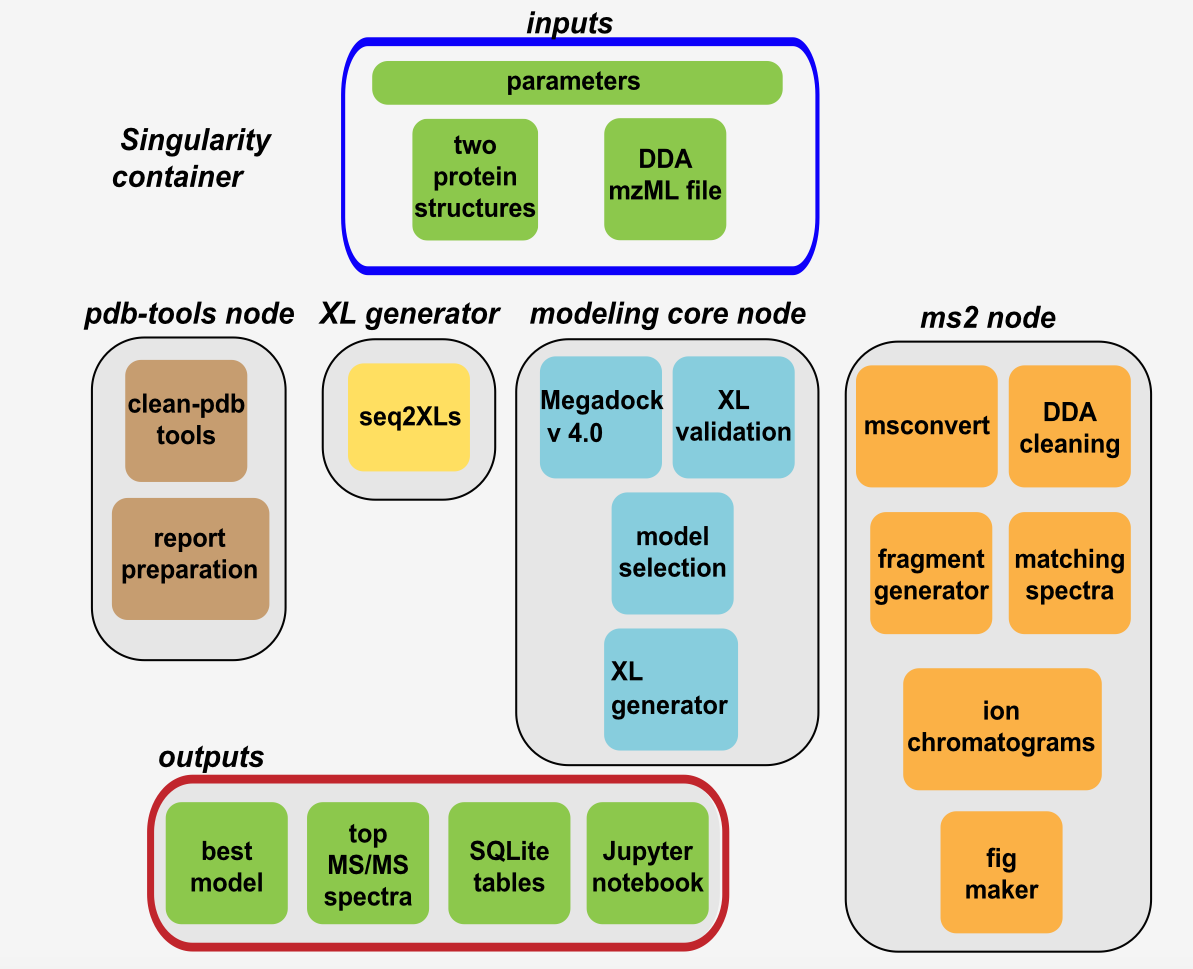
The schematic view below shows the computational workflow of Cheetah-MS. Generally, all nodes are implemented using applicake, making the whole workflow easy to connect and flexible for further development. To execute Cheetah, the user needs to provide two PDB files, and one MS/MS (DDA) mzML or mgf file containing the cross-linking MS data. These three files, together with the parameters are used as the inputs.
Cheetah-MS is composed of four main applicake nodes; PDB-tools, XL generator, modeling core, and MS2 nodes. The first node uses PDB-tools to clean the PDBs, recognize the chains, retrieve the sequences, and combine the two PDBs into a single file and make a simple conformational model. Meanwhile, the first template of the report together with the required information (from the input and first node) are stored in the working directory.
The next node (XL generator) takes the two sequences and provide a full list of all theoretically possible XLs without considering any distance cut-off. This list is passed to MS2 node for MS/MS (DDA) data analysis.
In MS2 node, in case the input file is not already in Mascot Generic Format (MGF), msconvert converts the input mzML file to make a mgf file format. This file goes for a filtering/cleaning process according to the XLs provided by previous step where only spectra that contain the monoisotopic mass/z of interest are passed to the filtered version of the file. For each XL in this node, a list of fragments is produced, and their pattern are checked through the filtered MGF file to find the match.
In modeling core node, selected XLs from MS2 node, are used to score a set of docking models (set to 10,000 models for all the runs), provided by Megadock v4.0, and the top percentile (according to a user-defined setting) are selected. A set of XLs with a pre-defined cut-off (32 Å) are produced for these models by XL generator to to report as the output.
Each model from modeling core, is scored by MS2 node and finally one model that support the largest number of XLs is selected as the best model to be visualized by NGL view.
Workflow
Cheetah-MS is free to all users. Input files analyzed by Cheetah-MS can be often large, however the processing time is considerably short (around 15 minutes). After submitting your job, a random link will be generated for the result page, so we recommend you to bookmark this link. This page will be refreshed every 10 seconds, however the average processing time is around 15 minutes.
Cheetah-MS is running based on a modified version of iPortal. Data and metadata are managed using openBIS, and finally the computational work is managed by GC3Pie. All scientific software are containerized using Singularity containers. Reports are generated using Jupyter Notebooks giving the users the ultimate flexibility to investigate the result and change the output figures for publication.
Below you can find detailed information about the current version of the Cheetah-MS web server to understand the workflow submission process and analyzing the data.
Input
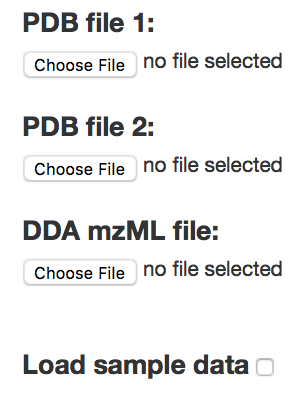
The submit page is devided into two sections: Inputs, and Advanced options.
As the input, you need to prepare two PDB files, and one MS/MS (DDA) mzML/mgf file. Please use cleaned PDB files as the output model shows the interaction between all chains of PDB1 with all chains of PDB2. If your PDBs contain HET atoms (or basically any extra atoms), please remove them before submission. We strongly suggest to only keep lines starting with ATOM in your pdb file. Please also note that keeping several extra chains in your PDB files (if they are not necessary for the macromolecular modeling) increases the number of hypothetical XLs as well as the processing time of your job.
Demo run:By clicking on "Load sample data" and then the "Submit" button, you can see the demo version of the workflow. All options (default options together with 2000 docking models) will be set automatically and you just need to submit. The processing time for the demo is around 10~15 minutes.
Note: Small "Help" buttons are located at the right submit page. You can check them quickly before submitting your job.
Advanced options
After selecting the data, you can set the parameters in "Advanced options" section to run the workflow. All the parameters are set as default and you can ignore this step unless you want to run the system with specific parameters.
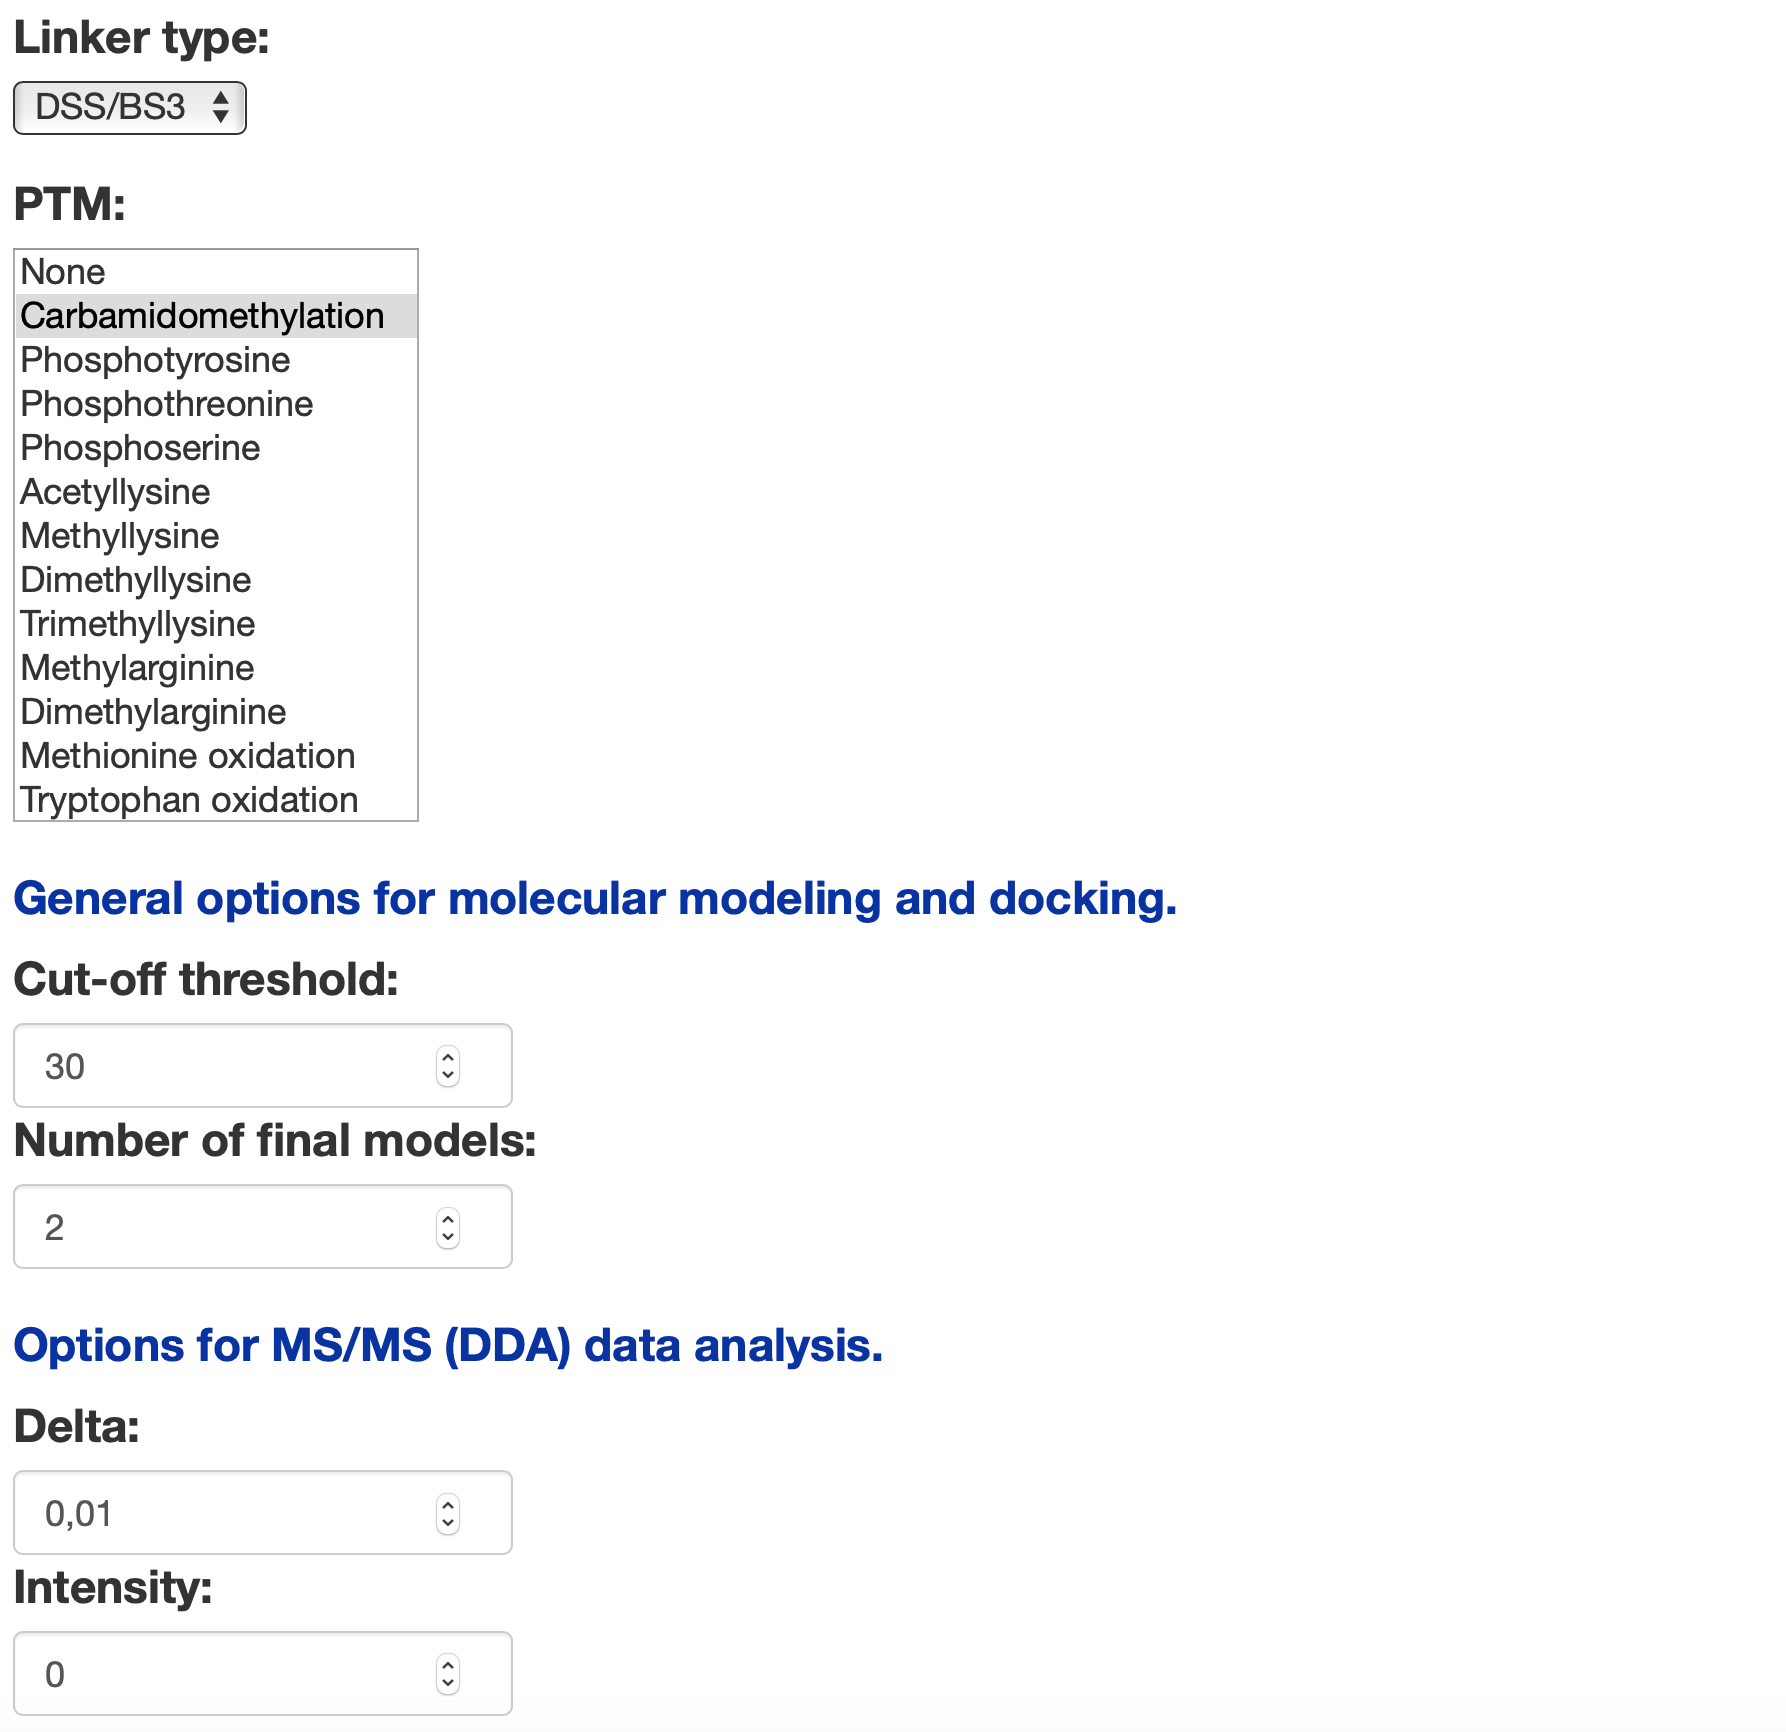
cut-off, is the threshold distance between two residues to consider a XL as valid or not. The default value is set for DSS which is 30 angstrom, but please note to set it correctly in case of using other linker agents.
number of final models, is the number of high-resolution models with the side chains packed to evaluate the final set of XL constraints. Increasing this number will result in more iterations on docking decoy evaluation and modeling and will generate more output models.
delta, is the MS2 delta window to compare fragments ions m/z with the base spectra. Increasing delta will result in increasing the false positive rate. In case of analyzing data related to purified samples, or if the number of proteins in your sample are a few, set delta to the minimum number.
intensity helps to remove the background noise in MS/MS data analysis. However, default is set to 0 as many peptides might be lost with higher intensities. You can set it up to 1000 if you're working with purified samples.
Linker type is added supporting three different non-cleavable cross-linker agents including DSS/BS3 with spacer arm length of 11.4 angstrom, DSG with shorter spacer arm length of 7.7 angstrom, and EGS with longer spacer arm length of 16.1 angstrom.
Post translational modifications (PTMs) are added to help understanding the enzymatic modification of the target proteins and to probe the effects of PTMs on output spectra. Here, the list includes 12 different PTMs that users can select one or many. Adding a PTM to your workflow will result in considering the m/z value changes on the output spectra and specifically on product ions.
Submit
After setting the parameters, you can submit the workflow using "Submit" button. Please note that once you click on the submit button, the uploading process will be started and depends on the size of your file, it may take few minutes to upload the data. So, please be patient and do not push the submit button several times.
After submitting the workflow you can check the status to see when it is finished. Status contains the job identifier at the top, and below that you can see detailed processing time of each submodule directly connecting and updating by the web server.
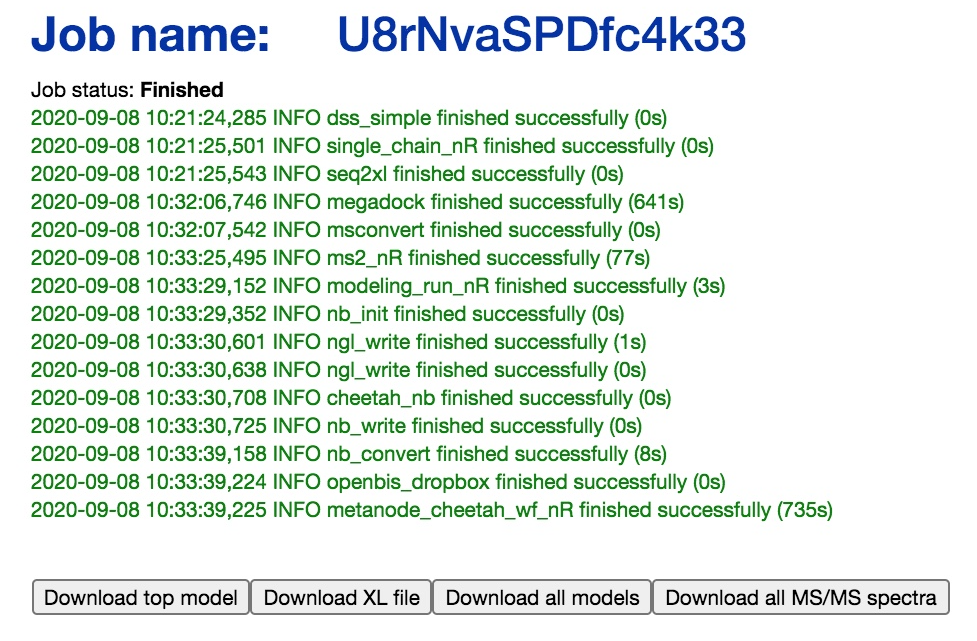
Generally, the maximum processing time can be up to 90 minutes depends to the size of mzML/mgf file, size of the input proteins, and the number of selected models. Once the workflow is finished, you can see the top model and the data analysis report in a Jupyter Notebook. We also provided four links to download the output data including the best selected model, the list of XLs supported by the best model, a zip file containing all top models based on the user input in the advanced options, and finally a zip file containing all selected MS/MS spectra with highest spectrum score.
Results
The result page here is provided in Jupyter Notebook giving the user ultimate flexibility to take advantage of the provided codes for data analysis and use them for further invistigation in the data. The result page generally contains the following information:
(a) Protein sequences that have been used for the analysis.
(b) Several data as a .zip file to make high quality publication images.
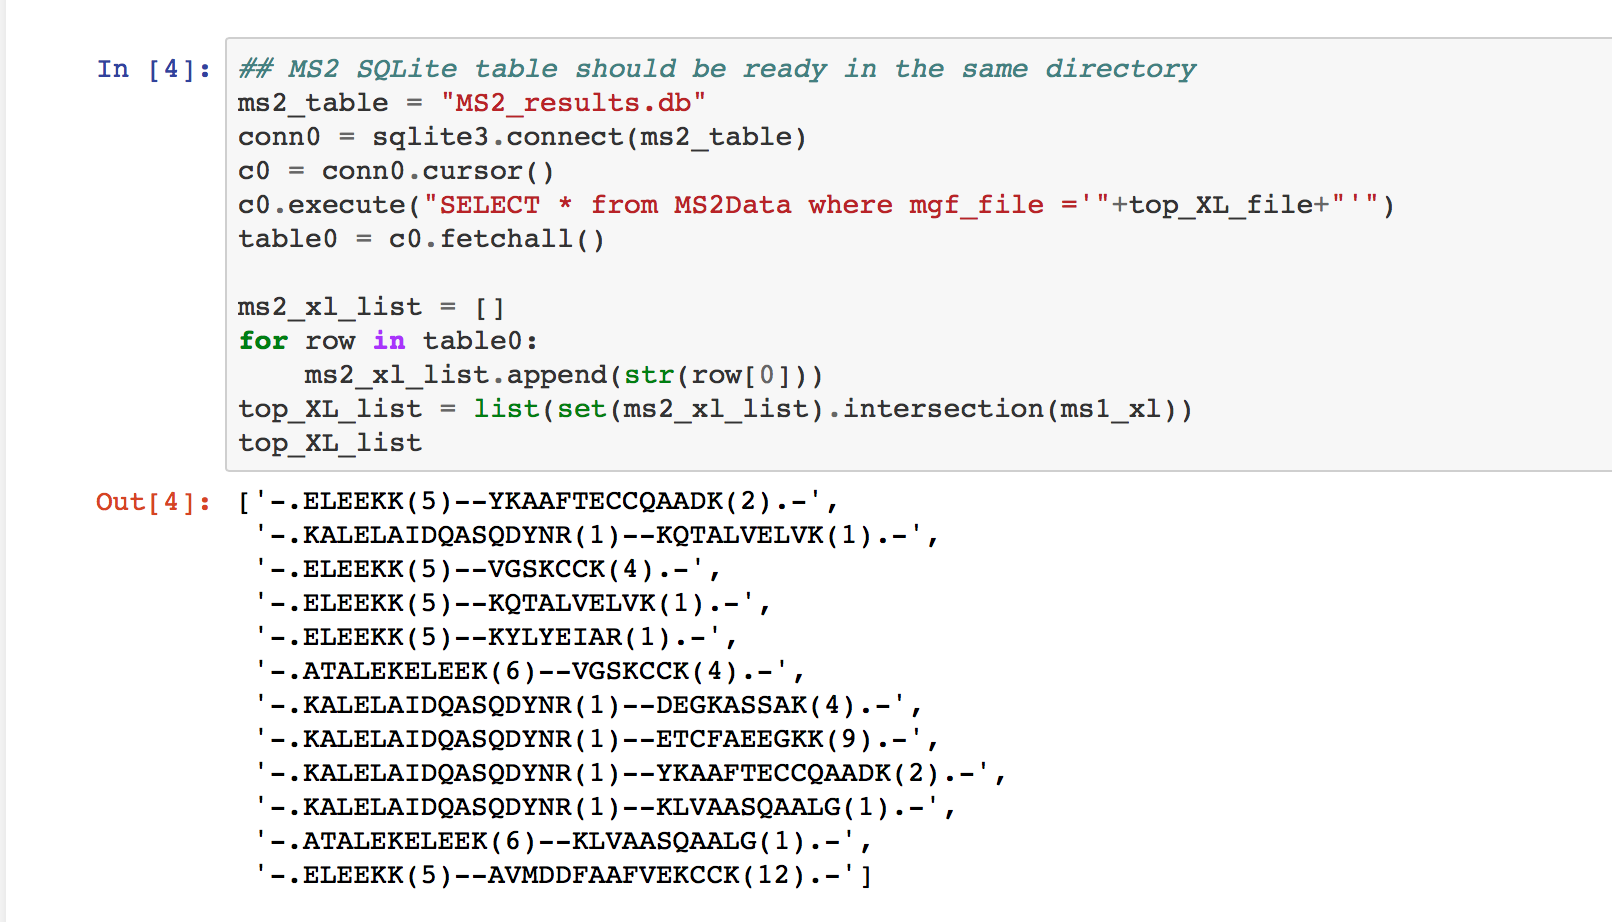
(c) Selected XLs in kojak format.
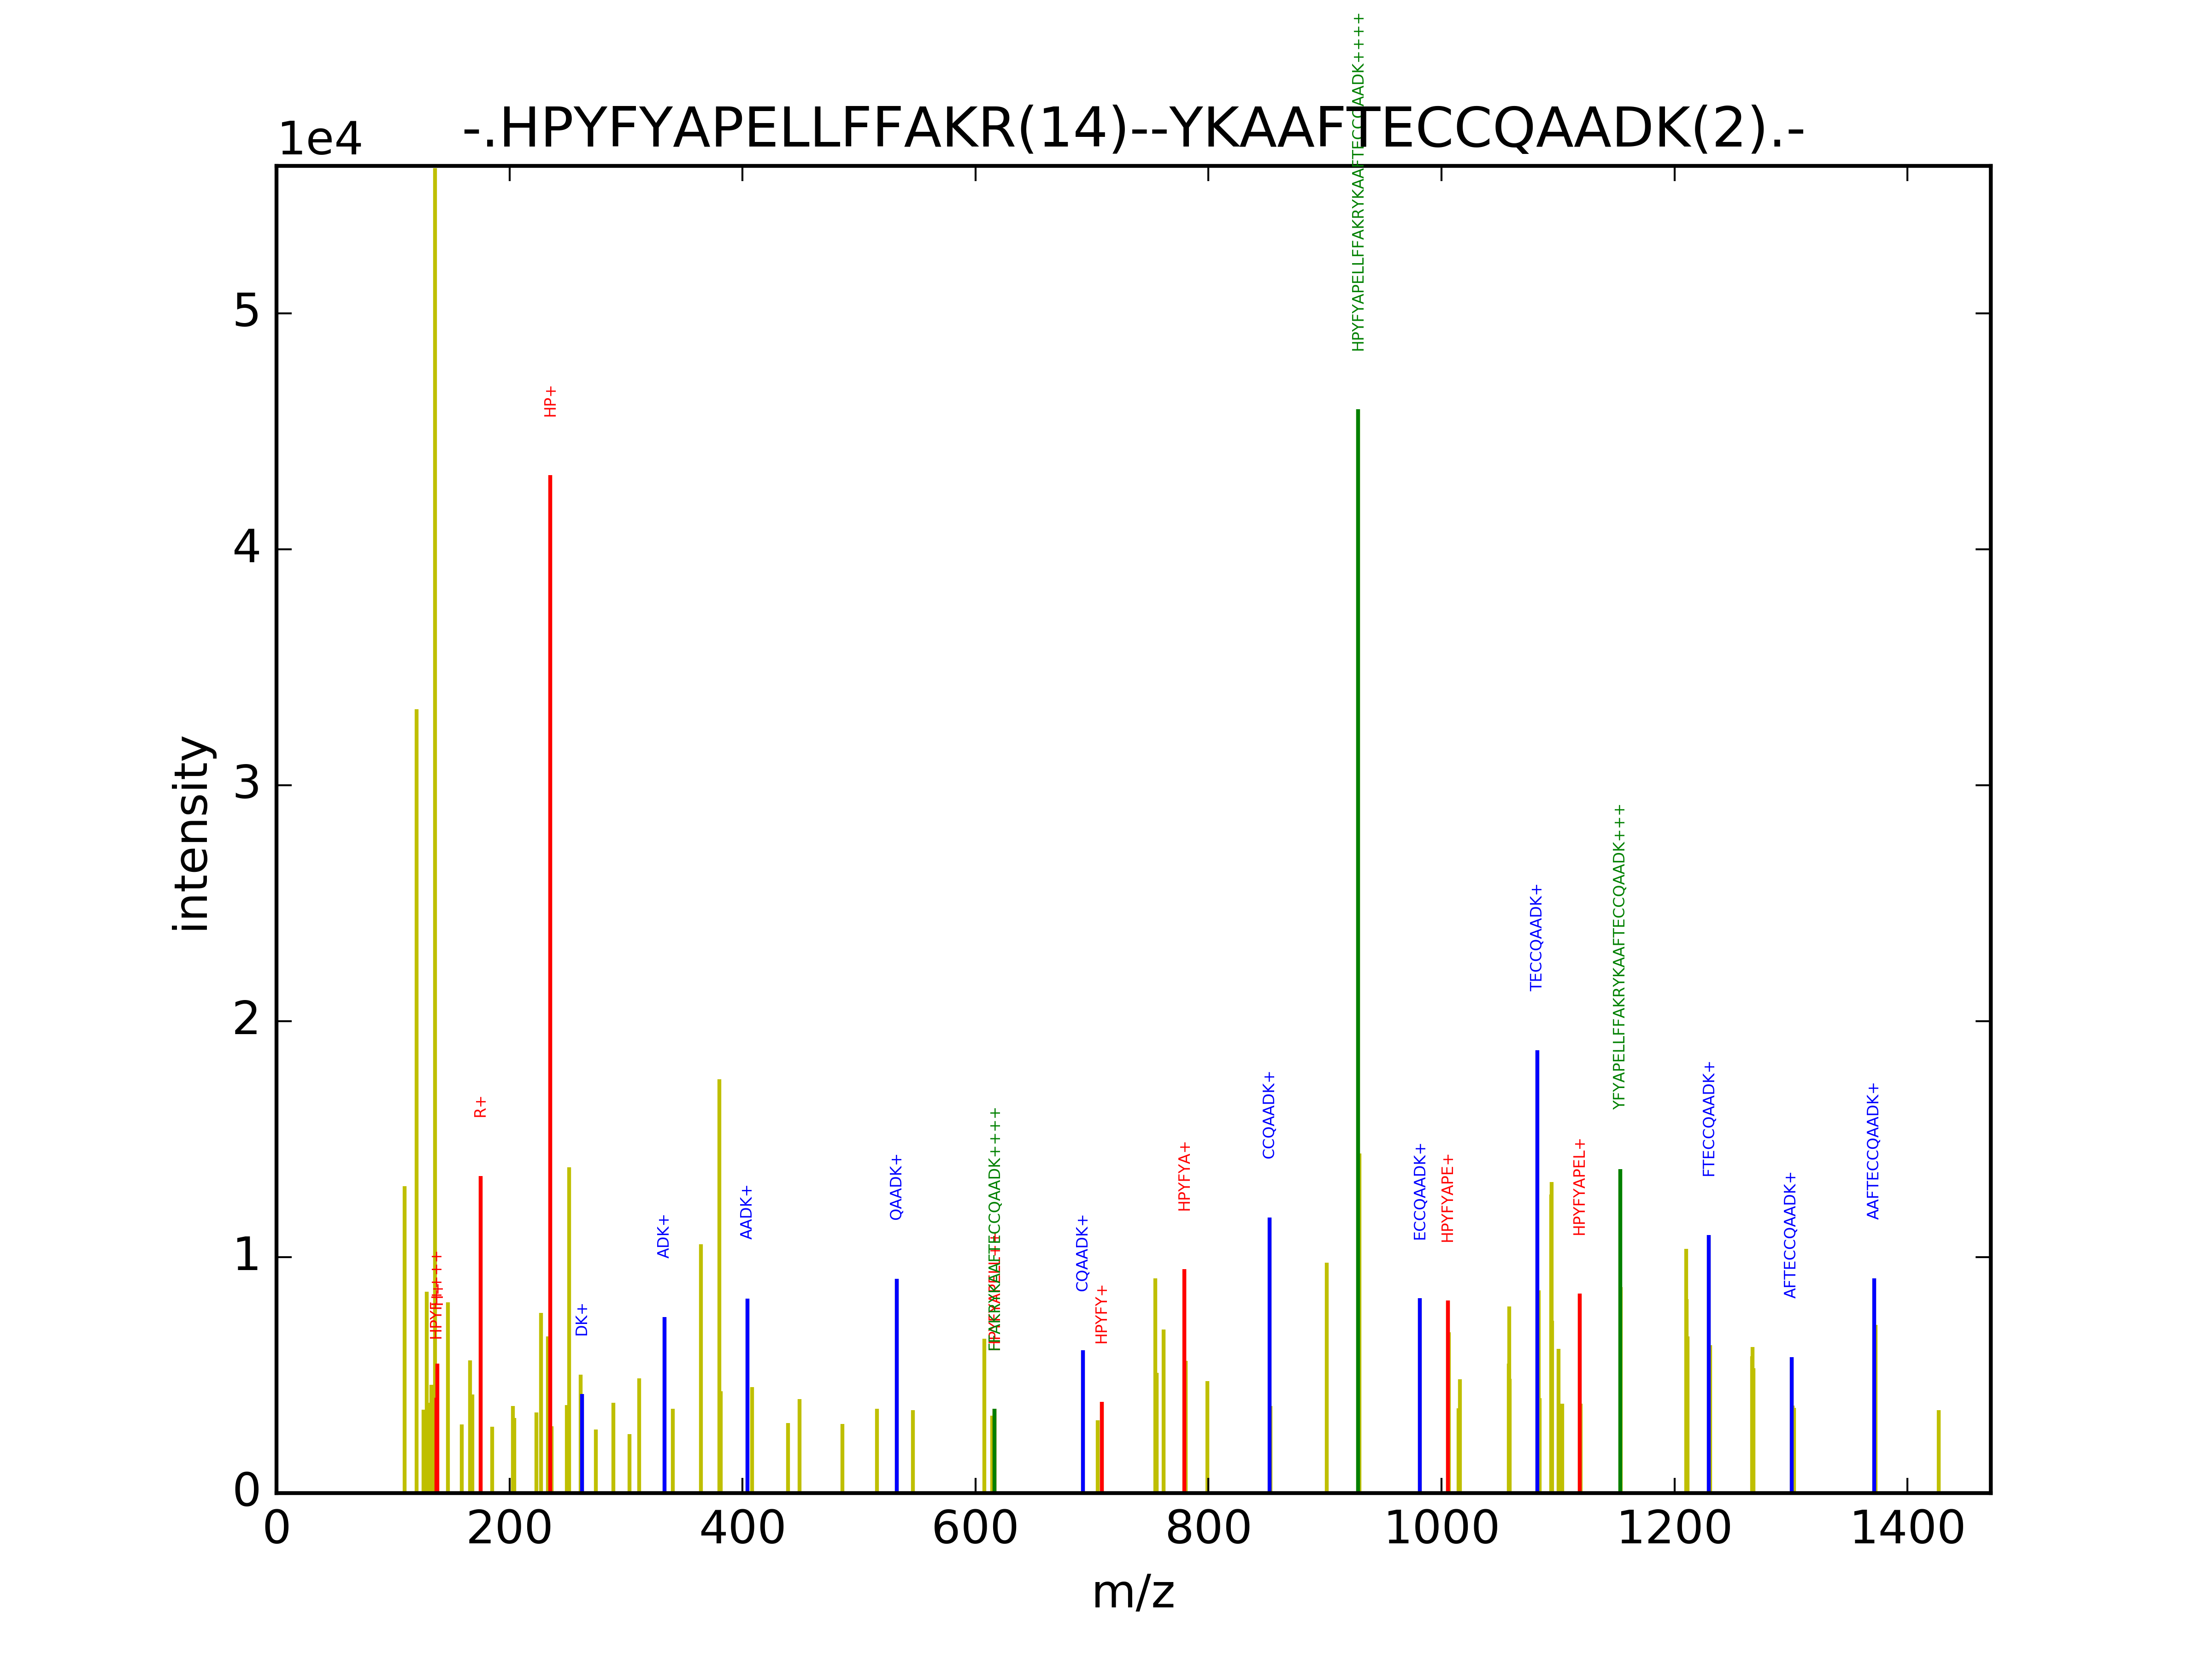
(d) Selected MS2 spectra for the top XLs. The spectrum is visulized here where the main spectra is shown in yellow, detected fragment ions of first and second peptides in red and blue, respectively, and finally, fragment ions containing ions from both peptides connected by the cross-linker arm in green. Please note that in the Jupyter Notebook, a simpler visualization (ions in red only and the main spectrum in gray) is defined to reduce the page rendering time. However, all top spectra are available in png format in a zip folder with the color scheme represented below.
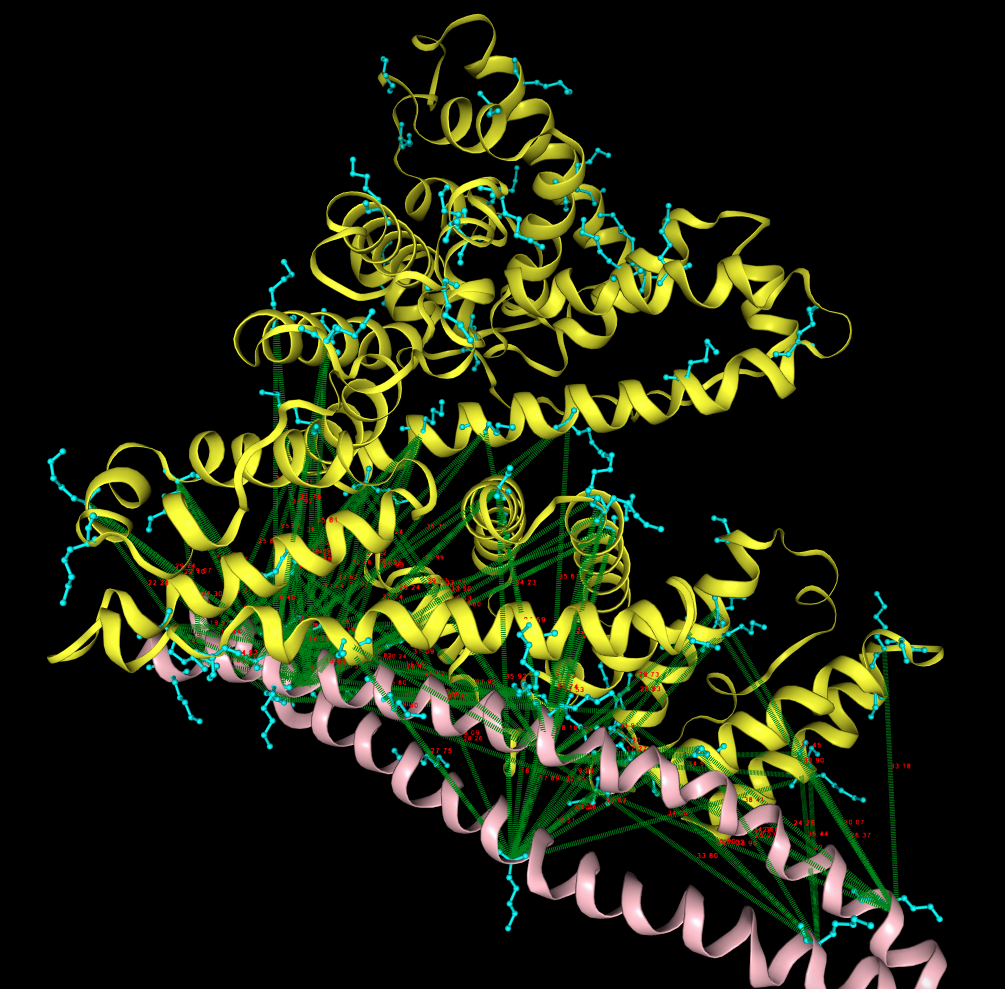
(e) The final model with XLs mapped on the structure visualized in NGL view. The two protein partners are in yellow and pink while detected XLs are depicted in green. Lysines are in cyan and XL distances (in Angstrom) are also shown in red for each Lysine-Lysine paires.
Example
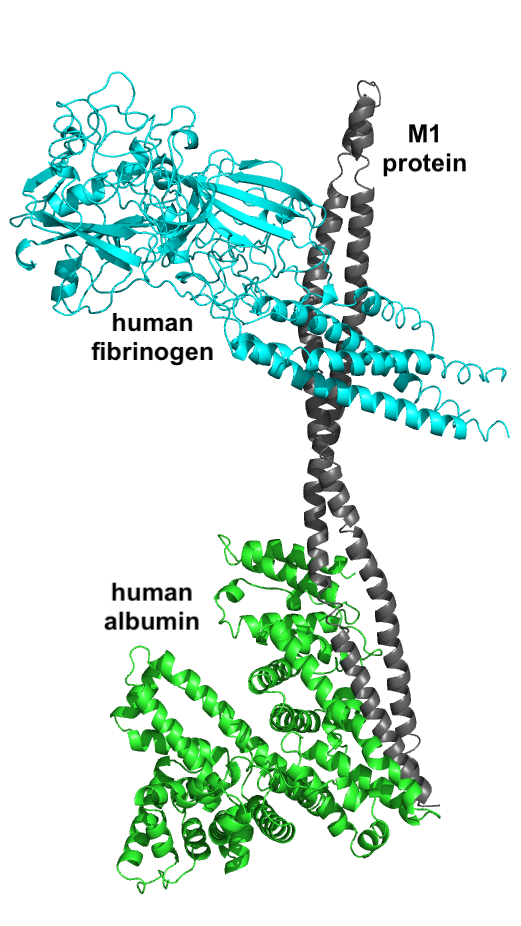
To test the applicability of the web server, we tried to reconstruct the Streptococcus pyogens M1 protein interactions with two human plasma proteins (fibrinogen and albumin) based on MS/MS samples provided on recombinant M1 protein and purified human plasma albumin and fibrinogen.
First, we tested the web server using M1, and fibrinogen interaction (PDB id: 2XNX/MN/ABC). The processing time on a compressed mzML file with size 285 MB was 25 minutes. The web server finished successfuly by returning 57 XLs (27 with strong spectra after manual validation) and the top model presented below to the left.
Then we repeated the test with M1 and human albumin (PDB id: 1E7I) with MS/MS file with size 313 MB where the processing time was slightly longer and around 35 minutes. The web server finished successfuly by returning 20 XLs (10 with strong spectra after manual validation) and the top model presented below on the right.
Note: Considering the information above regarding the PDB ids, you can download the available MS files from the reference manuscript (below the manual page) and test the workflow with default settings to obtain the same results. Also, you can target other interactions using samples related to intact bacteria cross-linked in human plasma. These samples include 1000s of proteins that can be further studied.
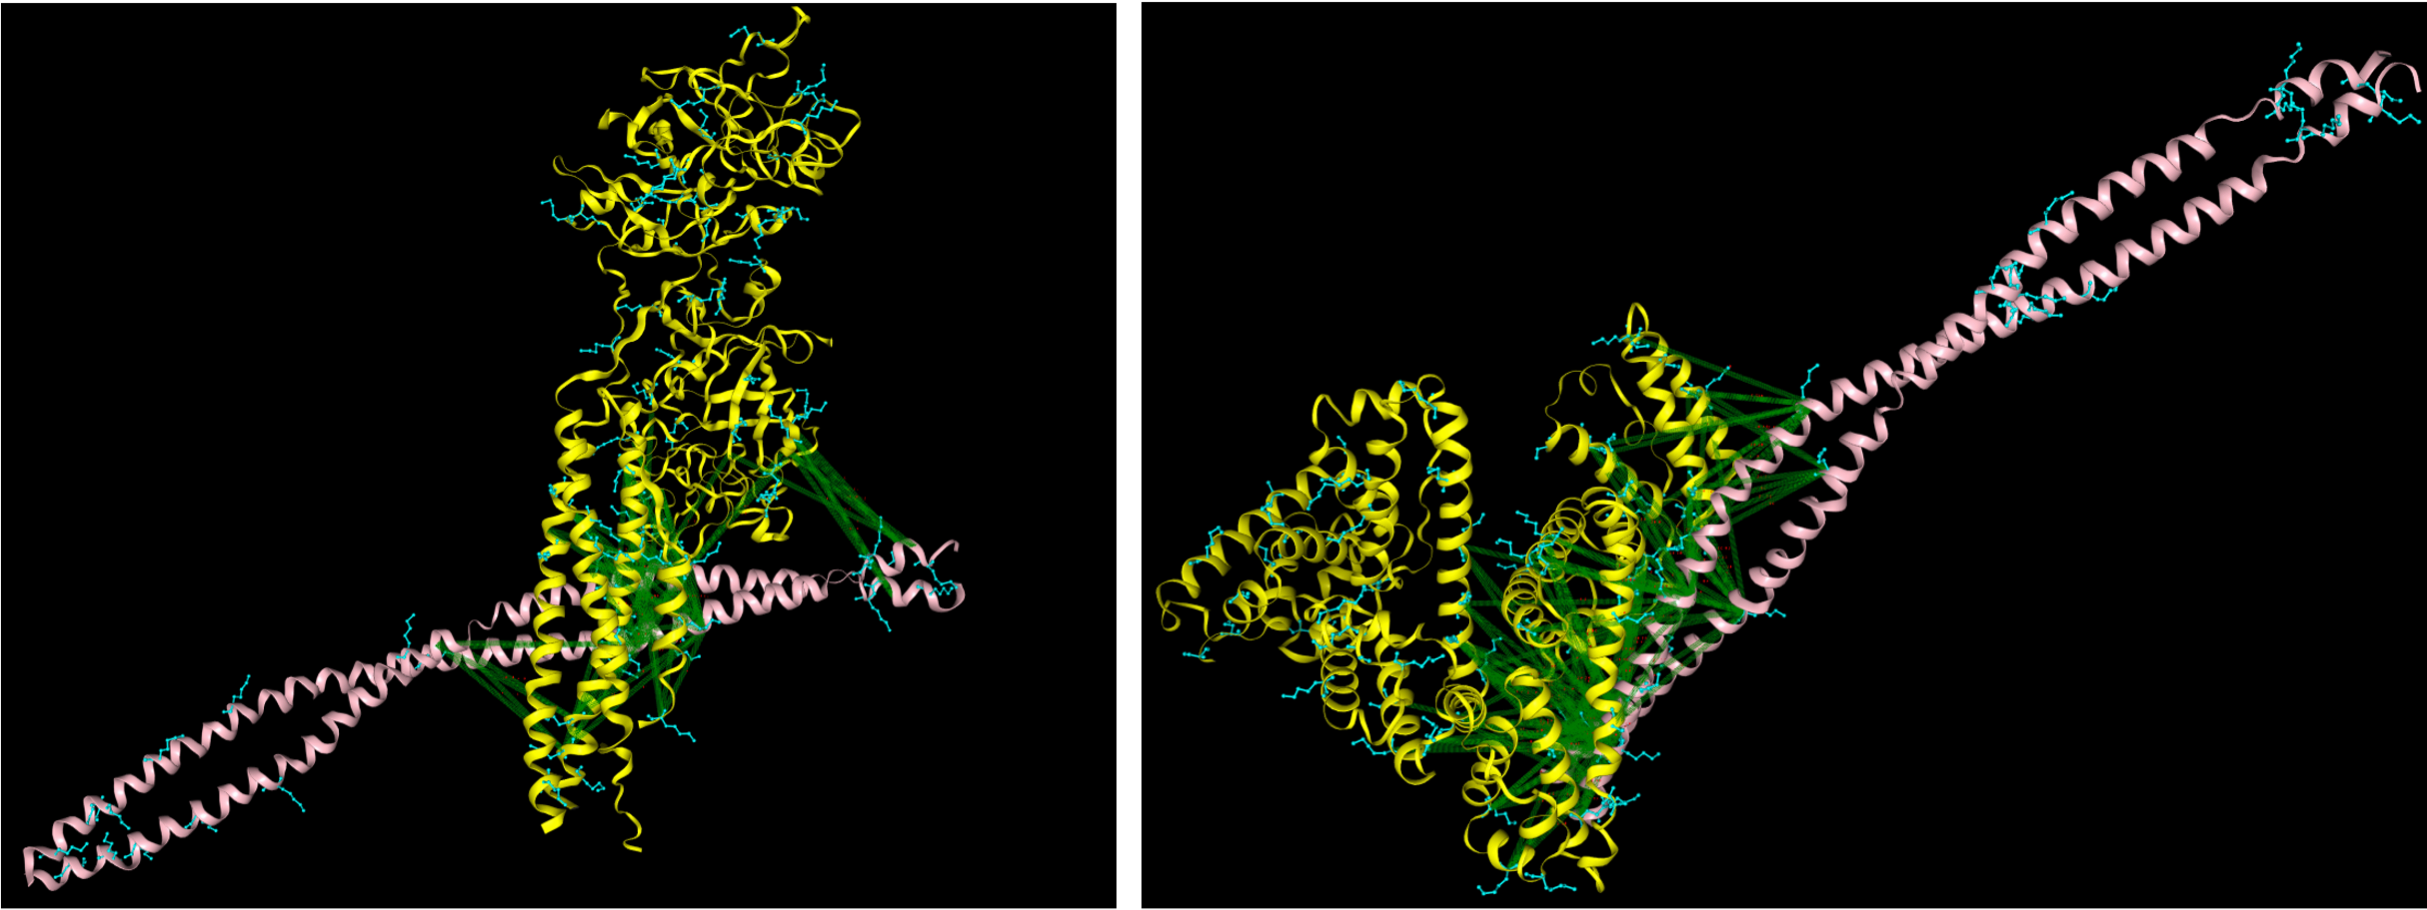
Finally, using this two models in a PyMOL session and aligning them based on the M1 protein which was in common between both runs, we were able to construct a preliminary structure of M1 interactome with two human plasma proteins with a processing time less than 1 hour (see figure below). Both the binding interfaces here are close to the native structure based on pevious investigation on M1 interactome (see manuscript in the reference).
Keywords
Cross-linking mass spectrometry; protein-protein interactions; host-pathogen interactions, computational modeling.
References
Hauri, S., Khakzad, H., Happonen, L., Malmstroem J., and Malmstroem L. Rapid determination of quaternary protein structures in complex biological samples. Nature Communications 10, 192 (2019) doi:10.1038/s41467-018-07986-1